Let's Talk Numbers
There has been so much talk lately trying to blame the market on Obama. Bob has been keeping track of MSNBC’s usage of a graph tracking the market since election day. So I wonder if the media would mind using some other numbers? DJIA when Bush took office: 10781 DJIA when Bush left office: 7949 […]

There has been so much talk lately trying to blame the market on Obama. Bob has been keeping track of MSNBC’s usage of a graph tracking the market since election day. So I wonder if the media would mind using some other numbers?
DJIA when Bush took office: 10781
DJIA when Bush left office: 7949
Now let’s compare that to those “horrible” times of the 90s the Republicans refer to so much:
DJIA When Clinton took office: 3241
DJIA When Clinton left office: 10781
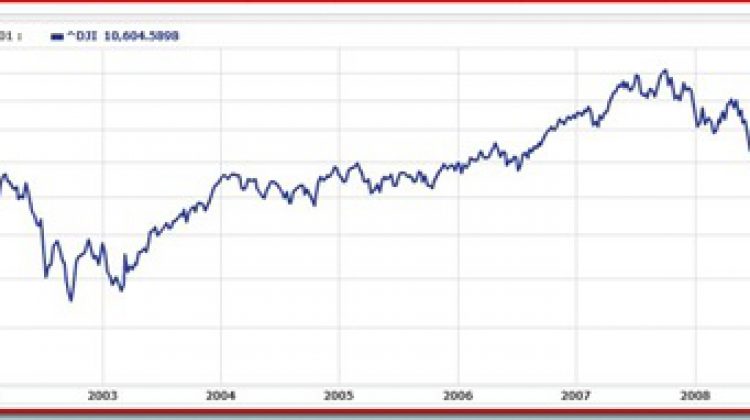
While Clinton more than tripled the stock market, Bush dropped it by 75%. And look at this graph. The Republicans and media can’t continue using the 9/11 or Iraq War meme:
The market more than recovered after 9/11 and well into the Iraq War. As matter of fact, the big nose dive wasn’t until last year. But was that from Election Day?
Sure the market has gone down since Obama took office, even since Election Day, but there was a much larger decline a month before the election. Funny how the media won’t enlarge their graph by a single month. I guess it would totally defeat their argument.


